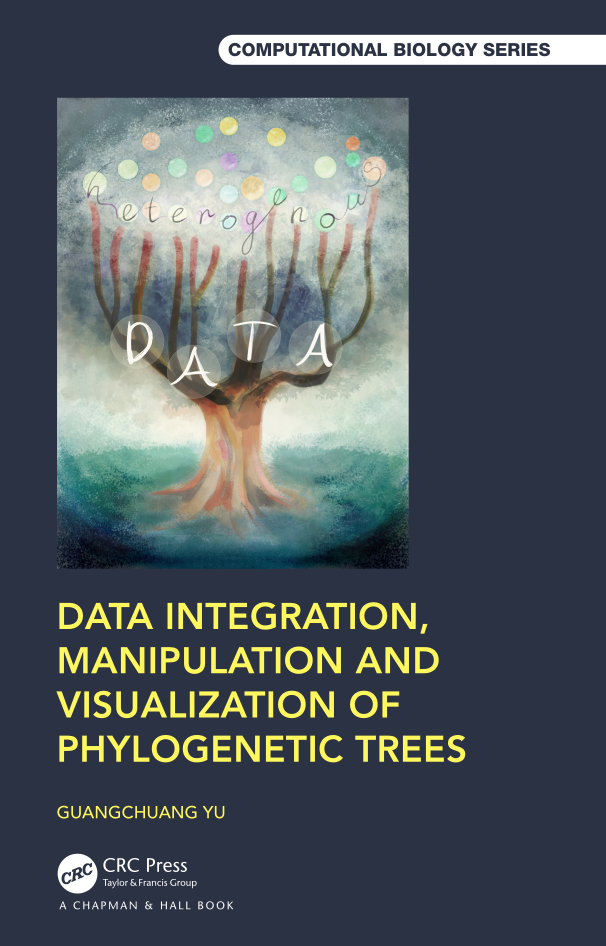
‘ggtree’ extends the ‘ggplot2’ plotting system which implemented the
grammar of graphics. ‘ggtree’ is designed for visualization and
annotation of phylogenetic trees and other tree-like structures with
their annotation data.
See also
https://yulab-smu.top/contribution-tree-data/
Guangchuang YU
School of Basic Medical Sciences, Southern Medical University
If you use ggtree in published research, please cite the most appropriate paper(s) from this list:
- S Xu, L Li, X Luo, M Chen, W Tang, L Zhan, Z Dai, TT. Lam, Y Guan, G Yu. Ggtree: A serialized data object for visualization of a phylogenetic tree and annotation data. iMeta, 2022, 1(4):e56. doi: 10.1002/imt2.56
- G Yu. Data Integration, Manipulation and Visualization of Phylogenetic Treess (1st edition). Chapman and Hall/CRC, 2022. doi: 10.1201/9781003279242
- G Yu. Using ggtree to visualize data on tree-like structures. Current Protocols in Bioinformatics, 2020, 69:e96. doi: 10.1002/cpbi.96
- G Yu*, TTY Lam, H Zhu, Y Guan*. Two methods for mapping and visualizing associated data on phylogeny using ggtree. Molecular Biology and Evolution, 2018, 35(2):3041-3043. doi: 10.1093/molbev/msy194
- G Yu, DK Smith, H Zhu, Y Guan, TTY Lam*. ggtree: an R package for visualization and annotation of phylogenetic trees with their covariates and other associated data. Methods in Ecology and Evolution. 2017, 8(1):28-36. doi: 10.1111/2041-210X.12628
We welcome any contributions! By participating in this project you agree to abide by the terms outlined in the Contributor Code of Conduct.


